A new way to unify app and website measurement in Google Analytics

People expect to interact with businesses when and how they like, such as browsing a brand's website to research a product and then purchasing it later using the brand's app. Getting insight into these cross-platform journeys is critical for businesses to predict customer needs and provide great experiences—but it can be very challenging.
Currently, many businesses measure app engagement with Google Analytics for Firebase and website engagement with Google Analytics. While each of these products separately offer powerful insights, getting a more unified picture of engagement across your app and website can be a manual and painstaking process.
To make this simpler, we’re announcing a new way to measure apps and websites together for the first time in Google Analytics.
Unified app and web analytics
First, we’re introducing a new property type, App + Web, that allows you to combine app and web data for unified reporting and analysis.
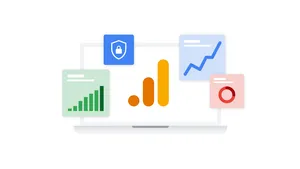
Measure your app and website together in Google Analytics
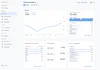
Reports for this new property use a single set of consistent metrics and dimensions, making it possible to see integrated reporting across app and web like never before. Now you can answer questions like: Which marketing channel is responsible for acquiring the most new users across your different platforms? How many total unique users do you have, regardless of which platform they use? How many conversions have occurred on your app and website in the last week—and which platform is driving most of these conversions?
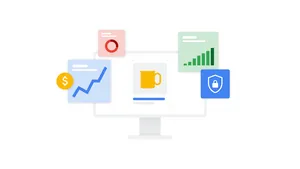
See combined metrics across your app and website
You can also go deeper to understand the effectiveness of your marketing campaigns across platforms. For example, you can see how many users started on your app then visited your website to make a purchase.
Flexible event measurement
Understanding how people engage with your app and website means that you need to measure a diverse range of user interactions like clicks, page views, app opens, and more. We’re making it easier to measure those actions on all of your platforms in a consistent way. The new property type utilizes a more flexible event-based model for collecting the unique interactions that users have with your content, allowing you to measure any custom event that you set up.
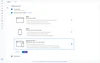
This event-based model also allows you to automate the manual work of tagging some of the events on your site with no additional coding required. In addition to page views, enhanced measurement allows you to measure many common web events like scrolls, downloads, video views and more with the flip of a toggle in the admin settings for your property.
Enhanced measurement helps you measure events with the flip of a toggle
Cross-platform analysis
Given the many different ways people interact with your brand between app and web, you need flexible tools to make sense of your data and discover insights unique to your business. The new Analysis module enables you to examine your data in ways that are not limited by pre-defined reports.
There are a number of techniques you can use including:
Exploration: Conduct ad-hoc analysis by dragging and dropping multiple variables—the different segments, dimensions, and metrics you use to measure your business—onto a canvas to see instant visualizations of your data.
The Exploration technique allows you to visualize your data with drag and drop ease
Funnels: Identify important steps to conversion and understand how users navigate among them—where they enter the funnel, as well as where they drop off—with both open and closed funnel options.
Understand how users engage with a sequence of key events on your app and website using the Funnels technique
Path analysis: Understand the actions users take between the steps within a funnel to help explain why users did or did not convert.
Visualize actions taken on the users’ path to conversion with the Path analysis technique
Once you’ve surfaced insights from your analysis, you can use the results to create audiences and use those audiences to deliver more relevant marketing experiences to your customers.
Start measuring across platforms
The first version of this new app and web experience—including the new event model and new analysis capabilities—will be available to all Analytics and Analytics 360 accounts in beta in the coming weeks. If you use Google Tag Manager or the global site tag for Google Analytics today, there’s no re-tagging required for your website. To include your app data, you’ll need the Firebase SDK implemented in your app. See how to get started in Google Analytics, or if you’re an existing Firebase customer, here’s how to upgrade.
If your business has both an app and website, and is looking for a more complete view of how your customers engage across both, we encourage you to participate in this beta and share your feedback. We are working to make Google Analytics the best possible solution for helping you understand the customer journey and create great customer experiences across platforms. Your partnership is essential to help us get there.