The Fast and the Curious
Speedometer 3: Building a benchmark that represents the web

Today’s The Fast and the Curious post covers the release of Speedometer 3.0 an upgraded browser benchmarking tool to optimize the performance of Web applications.
In collaboration with major web browser engines, Blink/V8, Gecko/SpiderMonkey, and WebKit/JavaScriptCore, we’re excited to release Speedometer 3.0. Benchmarks, like Speedometer, are tools that can help browser vendors find opportunities to improve performance. Ideally, they simulate functionality that users encounter on typical websites, to ensure browsers can optimize areas that are beneficial to users.
Let’s dig into the new changes in Speedometer 3.0.
Applying a multi-stakeholder governance model
Since its initial release in 2014 by the WebKit team, browser vendors have successfully used Speedometer to optimize their engines and improve user experiences on the web. Speedometer 2.0, a result of a collaboration between Apple and Chrome, followed in 2018, and it included an updated set of workloads that were more representative of the modern web at that time.
The web has changed a lot since 2018, and so has Speedometer in its latest release, Speedometer 3. This work has been based on a joint multi-stakeholder governance model to share work, and build a collaborative understanding of performance on the web to help drive browser performance in ways that help users. The goal of this collaborative project is to create a shared understanding of web performance so that improvements can be made to enhance the user experience. Together, we were able to to improve how Speedometer captures and calculates scores, show more detailed results and introduce an even wider variety of workloads. This cross-browser collaboration introduced more diverse perspectives that enabled clearer insights into a broader set of web users and workflows, ensuring the newest version of Speedometer will help make the web better for everyone, regardless of which browser they use.
Why is building workloads challenging?
Building a reliable benchmark with representative tests and workloads is challenging enough. That task becomes even more challenging if it will be used as a tool to guide optimization of browser engines over multiple years. To develop the Speedometer 3 benchmark, the Chrome Aurora team, together with colleagues from other participating browser vendors, were tasked with finding new workloads that accurately reflect what users experience across the vast, diverse and eclectic web of 2024 and beyond.
A few tests and workloads can’t simulate the entire web, but while building Speedometer 3 we have established some criteria for selecting ones that are critical to user’s experience. We are now closer to a representative benchmark than ever before. Let’s take a look at how Speedometer workloads evolved
How did the workloads change?
Since the goal is to use workloads that are representative of the web today, we needed to take a look at the previous workloads used in Speedometer and determine what changes were necessary. We needed to decide which frameworks are still relevant, which apps needed updating and what types of work we didn’t capture in previous versions. In Speedometer 2, all workloads were variations of a todo app implemented in different JS frameworks. We found that, as the web evolved over the past six years, we missed out on various JavaScript and Browser APIs that became popular, and apps tend to be much larger and more complicated than before. As a result, we made changes to the list of frameworks we included and we added a wider variety of workloads that cover a broader range of APIs and features.
Frameworks
To determine which frameworks to include, we used data from HTTP Archive and discussed inclusion with all browser vendors to ensure we cover a good range of implementations. For the initial evaluation, we took a snapshot of the HTTP Archive from March 2023 to determine the top JavaScript UI frameworks currently used to build complex web apps.

Another approach is to determine inclusion based on popularity with developers: Do we need to include frameworks that have “momentum”, where a framework's current usage in production might be low, but we anticipate growth in adoption? This is somewhat hard to determine and might not be the ideal sole indicator for inclusion. One data point to evaluate momentum might be monthly NPM downloads of frameworks.
Here are the same 15 frameworks NPM downloads for March 2023:

With both data points on hand, we decided on a list that we felt gives us a good representation of frameworks. We kept the list small to allow space for brand new types of workloads, instead of just todo apps. We also selected commonly used versions for each framework, based on the current usage.

In addition, we updated the previous JavaScript implementations and included a new web-component based version, implemented with vanilla JavaScript.
More Workloads
A simple Todo-list only tests a subset of functionality. For example: how well do browsers handle complicated flexbox and grid layouts? How can we capture SVG and canvas rendering and how can we include more realistic scenarios that happen on a website?
We collected and categorized areas of interest into DOM, layout, API and patterns, to be able to match them to potential workloads that would allow us to test these areas. In addition we collected user journeys that included the different categories of interest: editing text, rendering charts, navigating a site, and so on.

There are many more areas that we weren’t able to include, but the final list of workloads presents a larger variety and we hope that future versions of Speedometer will build upon the current list.
Validation
The Chrome Aurora team worked with the Chrome V8 team to validate our assumptions above. In Chrome, we can use runtime-call-stats to measure time spent in each web API (and additionally many internal components). This allows us to get an insight into how dominant certain APIs are.
If we look at Speedometer 2.1 we see that a disproportionate amount of benchmark time is spent in innerHTML.

While innerHTML is an important web API, it's overrepresented in Speedometer 2.1. Doing the same analysis on the new version 3.0 yields a slightly different picture:
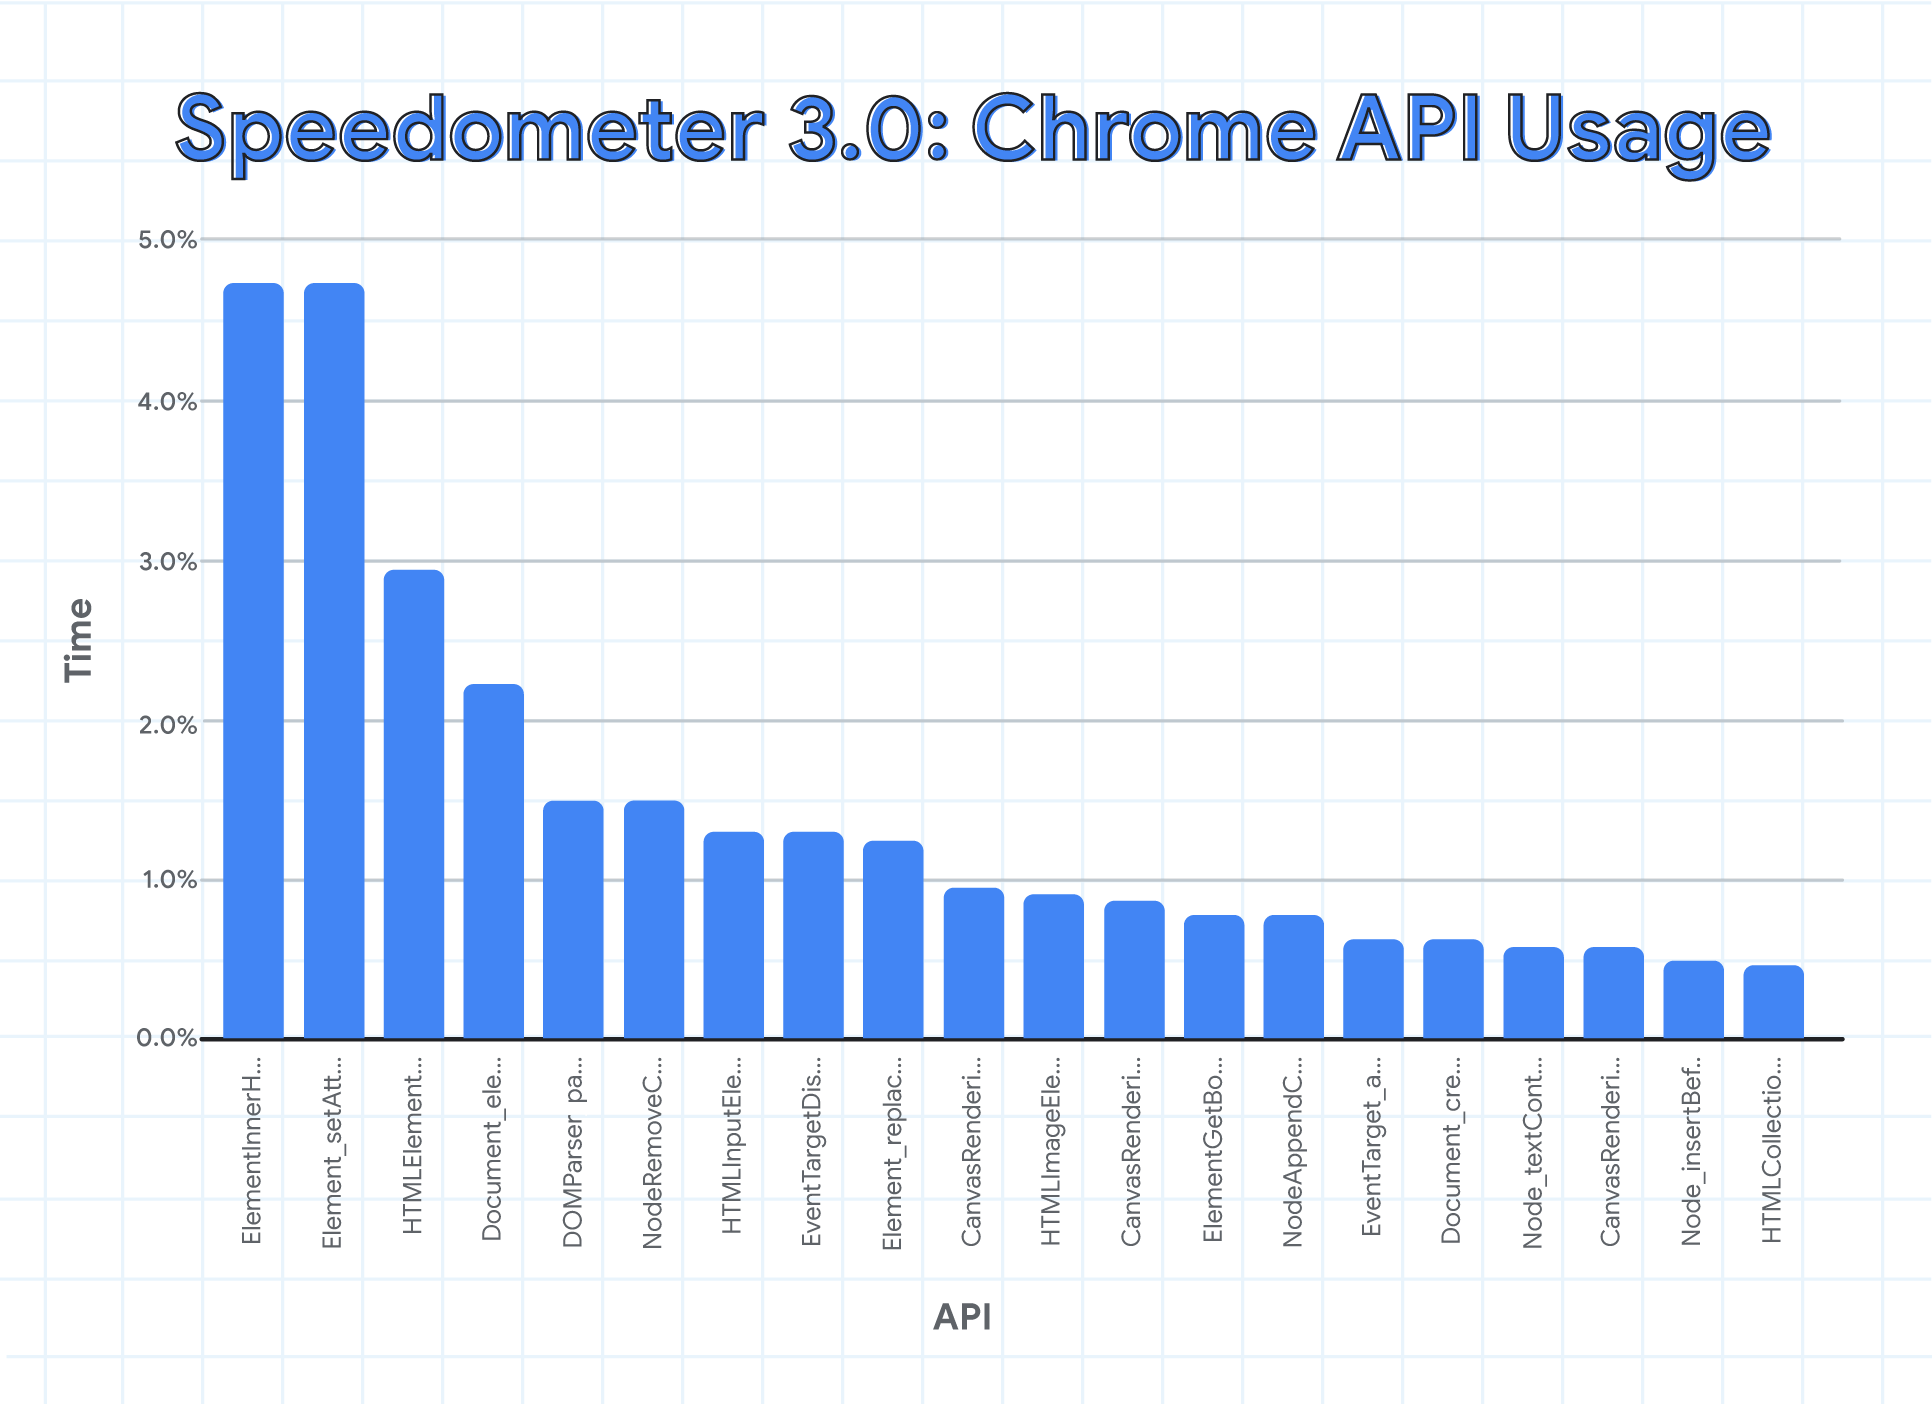
We can see that innerHTML is still present, but its overall contribution shrunk from roughly 14% down to 4.5%. As a result, we get a better distribution that favors more DOM APIs to be optimized. We can also see that a few Canvas APIs have moved into this list, thanks to the new workloads in v3.0.
While we will never be able to perfectly represent the whole web in a fast-running and stable benchmark, it is clear that Speedometer 3.0 is a giant step in the right direction.
Ultimately, we ended up with the following list of workloads presented in the next few sections.
What workloads are included?
TodoMVC
Many developers might recognize the TodoMVC app. It’s a popular resource for learning and offers a wide range of TodoMVC implementations with different frameworks.

TodoMVC is a to-do application that allows a user to keep track of tasks. The user can enter a new task, update an existing one, mark a task as completed, or delete it. In addition to the basic CRUD operations, the TodoMVC app has some added functionality: filters are available to change the view to “all”, “active” or “completed” tasks and a status text displays the number of active tasks to complete.
In Speedometer, we introduced a local data source for todo items, which we use in our tests to populate the todo apps. This gave us the opportunity to test a larger character set with different languages.
The tests for these apps are all similar and are relatable to typical user journeys with a todo app:
- Add a task
- Mark task as complete
- Delete task
- Repeat steps 1-3 a set amount of times
These tests seem simple, but it lets us benchmark DOM manipulations. Having a variety of framework implementations also cover several different ways how this can be done.
Complex DOM / TodoMVC
The complex DOM workloads embed various TodoMVC implementations in a static UI shell that mimics a complex web page. The idea is to capture the performance impact on executing seemingly isolated actions (e.g. adding/deleting todo items) in the context of a complex website. Small performance hits that aren’t obvious in an isolated TodoMVC workload are amplified in a larger application and therefore capture more real-world impact.
The tests are similar to the TodoMVC tests, executed in the complex DOM & CSSOM environment.
This introduces an additional layer of complexity that browsers have to be able to handle effortlessly.

Single-page-applications (News Site)
Single-page-applications (SPAs) are widely used on the web for streaming, gaming, social media and pretty much anything you can imagine. A SPA lets us capture navigating between pages and interacting with an app. We chose a news site to represent a SPA, since it allows us to capture the main areas of interest in a deterministic way. An important factor was that we want to ensure we are using static local data and that the app doesn’t rely on network requests to present this data to the user.
Two implementations are included: one built with Next.js and the other with Nuxt. This gave us the opportunity to represent applications built with meta frameworks, with the caveat that we needed to ensure to use static outputs.
.png)
Tests for the news site mimic a typical user journey, by selecting a menu item and navigating to another section of the site.
- Click on ‘More’ toggle of the navigation
- Click on a navigation button
- Repeat steps 1 and 2 a set amount of times
These tests let us evaluate how well a browser can handle large DOM and CSSOM changes, by changing a large amount of data that needs to be displayed when navigating to a different page.
Charting Apps & Dashboards
Charting apps allow us to test SVG and canvas rendering by displaying charts in various workloads.
These apps represent popular sites that display financial information, stock charts or dashboards.
Both SVG rendering and the use of the canvas api weren’t represented in previous releases of Speedometer.
Observable Plot displays a stacked bar chart, as well as a dotted chart. It is based on D3, which is a JavaScript library for visualizing tabular data and outputs SVG elements. It loops through a big dataset to build the source data that D3 needs, using map, filter and flatMap methods. As a result this exercises creation and copying of objects and arrays.
Chart.js is a JavaScript charting library. The included workload displays a scatter graph with the canvas api, both with some transparency and with full opacity. This uses the same data as the previous workload, but with a different preparation phase. In this case it makes a heavy use of trigonometry to compute distances between airports.
React Stockcharts displays a dashboard for stocks. It is based on D3 for all computation, but outputs SVG directly using React.
Webkit Perf-Dashboard is an application used to track various performance metrics of WebKit. The dashboard uses canvas drawing and web components for its ui.
These workloads test DOM manipulation with SVG or canvas by interacting with charts. For example here are the interactions of the Observable Plot workload:
- Prepare data: compute the input datasets to output structures that D3 understands.
- Add stacked chart: this draws a chart using SVG elements.
- Change input slider to change the computation parameters.
- Repeat steps 1 and 2
- Reset: this clears the view
- Add dotted chart: this draws another type of graph (dots instead of bars) to exercise different drawing primitives. This also uses a power scale.


Code Editors
Editors, for example WYSIWYG text and code editors, let us focus on editing live text and capturing form interactions. Typical scenarios are writing an email, logging into a website or filling out an online form. Although there is some form interaction present in the TodoMVC apps, the editor workloads use a large data set, which lets us evaluate performance more accurately.

Codemirror is a code editor that implements a text input field with support for many editing features. Several languages and frameworks are available and for this workload we used the JavaScript library from Codemirror.
Tiptap Editor is a headless, framework-agnostic rich text editor that's customizable and extendable. This workload used Tiptap as its basis and added a simple ui to interact with.
Both apps test DOM insertion and manipulation of a large amount of data in the following way:
- Create an editable element.
- Insert a long text.: Codemirror uses the development bundle of React, whileTipTap loads an excerpt of Proust’s Du Côté de Chez Swann.
- Highlight text: Codemirror turns on syntax highlighting, while TipTap sets all the text to bold.
Parting words
Being able to collaborate with all major browser vendors and having all of us contribute to workloads has been a unique experience and we are looking forward to continuing to collaborate in the browser benchmarking space.
Don’t forget to check out the new release of Speedometer and test it out in your favorite browser, dig into the results, check out our repo and feel free to open issues with any improvements or ideas for workloads you would like to see included in the next version. We are aiming for a more frequent release schedule in the future and if you are a framework author and want to contribute, feel free to file an issue on our Github to start the discussion.

