Our data centers now work harder when the sun shines and wind blows
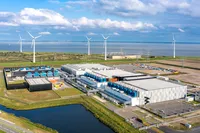
Addressing the challenge of climate change demands a transformation in how the world produces and uses energy. Google has been carbon neutral since 2007, and 2019 marks the third year in a row that we’ve matched our energy usage with 100 percent renewable energy purchases. Now, we’re working toward 24x7 carbon-free energy everywhere we have data centers, which deliver our products to billions of people around the world. To achieve 24x7 carbon-free energy, our data centers need to work more closely with carbon-free energy sources like solar and wind.
New carbon-intelligent computing platform
Our latest advancement in sustainability, developed by a small team of engineers, is a new carbon-intelligent computing platform. We designed and deployed this first-of-its kind system for our hyperscale (meaning very large) data centers to shift the timing of many compute tasks to when low-carbon power sources, like wind and solar, are most plentiful. This is done without additional computer hardware and without impacting the performance of Google services like Search, Maps and YouTube that people rely on around the clock. Shifting the timing of non-urgent compute tasks—like creating new filter features on Google Photos, YouTube video processing, or adding new words to Google Translate—helps reduce the electrical grid’s carbon footprint, getting us closer to 24x7 carbon-free energy.
Visualization of how we shift compute tasks to different times of day to align with the availability of lower-carbon energy. In this illustration, wind energy in the evening and solar energy during the day.
Each day, at every Google data center, our carbon-intelligent platform compares two types of forecasts for the following day. One of the forecasts, provided by our partner Electricity Maps, predicts how the average hourly carbon intensity of the local electrical grid will change over the course of a day. A complementary Google internal forecast predicts the hourly power resources that a data center needs to carry out its compute tasks during the same period. Then, we use the two forecasts to optimize hour-by-hour guidelines to align compute tasks with times of low-carbon electricity supply. Early results demonstrate carbon-aware load shifting works. Results from our pilot suggest that by shifting compute jobs we can increase the amount of lower-carbon energy we consume.
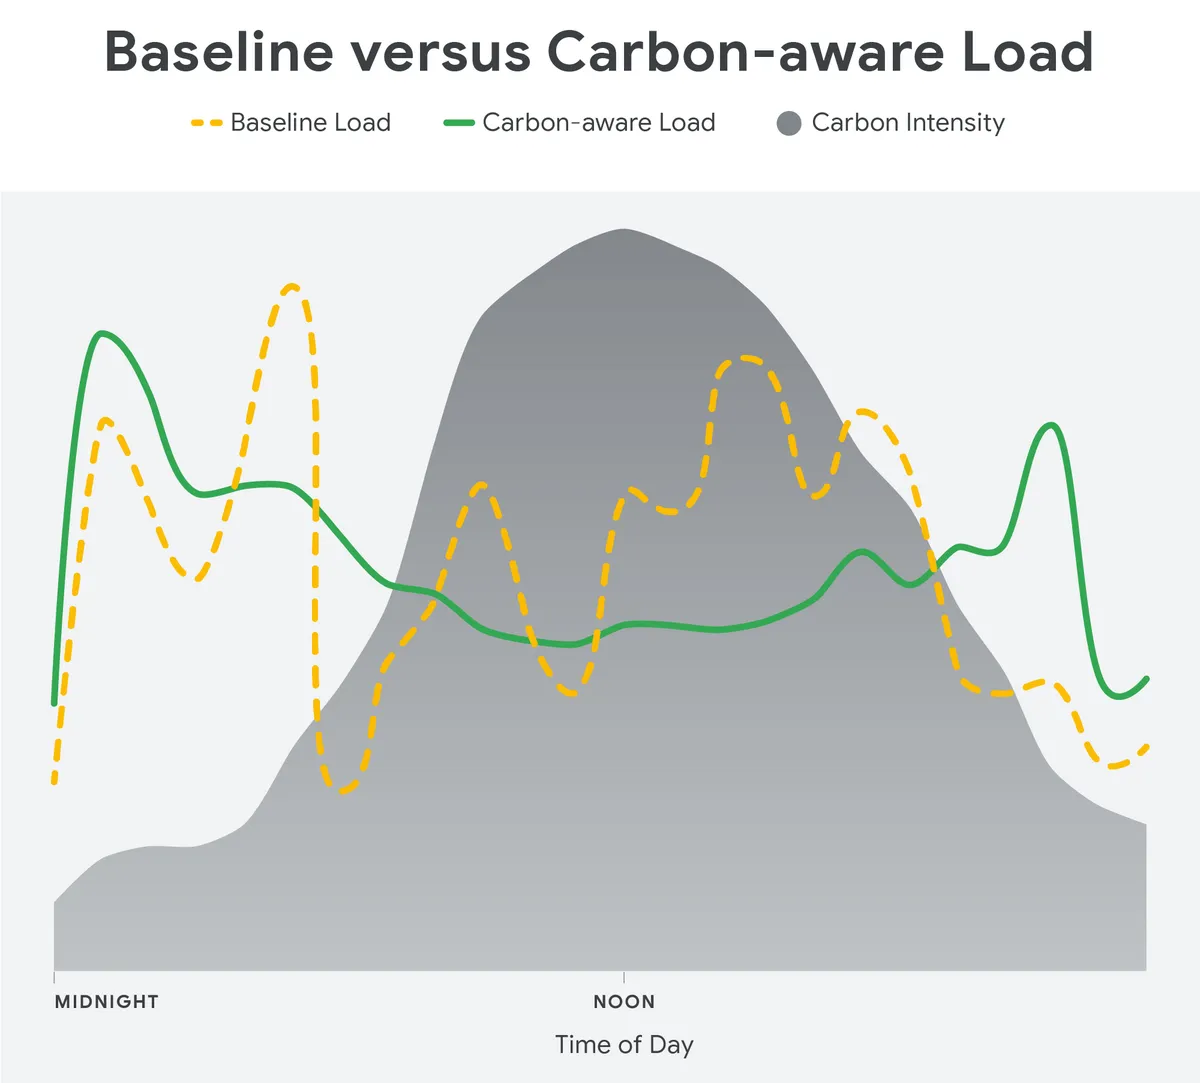
Data from our pilot illustrates how the new system shifts compute from our baseline (dashed line) to better align with less carbon-intensive times of the day—such as early morning and late evening (solid line)—when wind energy is most plentiful. Gray shading represents times of day when more carbon-intensive energy is present on the grid.
What’s next
The first version of this carbon-intelligent computing platform focuses on shifting tasks to different times of the day, within the same data center. But, it’s also possible to move flexible compute tasks between different data centers, so that more work is completed when and where doing so is more environmentally friendly. Our plan for the future is to shift load in both time and location to maximize the reduction in grid-level CO2 emissions. Our methodology, including performance results of our global rollout, will be shared in upcoming research publications. We hope that our findings inspire other organizations to deploy their own versions of a carbon-intelligent platform, and together, we can continue to encourage the growth of carbon-free electricity worldwide. Learn more about Google’s progress toward a carbon-free future on our Sustainability site.


