New sustainability tools help businesses and cities map environmental information
Climate change is a defining challenge of our generation, and addressing it requires collective effort. To help everyone take action, we’re working to share insights about the planet through tools and technologies — like Google Earth, Earth Engine and Environmental Insights Explorer — that combine a rich map of the world with advanced AI. With insights into how the planet is changing, we can build sustainability tools and support other organizations to do the same. And we can work toward our ambition to help individuals, cities, and partners collectively reduce 1 gigaton of their carbon equivalent emissions annually by 2030.
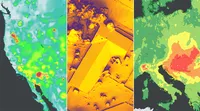
Now we’re expanding our sustainability offerings with new products in Google Maps Platform. These products apply AI and machine learning, along with aerial imagery and environmental data, to provide up-to-date information about solar potential, air quality and pollen levels. With this technology, developers, businesses and organizations can build tools that map and mitigate environmental impact.
Mapping the potential of solar energy
To encourage the use of solar technology, we launched Project Sunroof in 2015 to help people explore the estimated solar potential and savings in their area. Companies soon became interested in accessing this information too, and now, we’re offering this information to businesses. Our new Solar API uses mapping and computing resources to make detailed rooftop solar potential data available for more than 320 million buildings across 40 countries, like the U.S., France and Japan.
To get these insights, we trained an AI model to extract 3D information about the roof geometry directly from aerial imagery, along with details about trees and shade. Plus, the Solar API accounts for factors like historical weather patterns in the area, energy costs and more. This means that businesses like solar installers can see how much sunlight buildings receive and potential energy savings, before even visiting the area. In turn, this technology allows homeowners to more quickly and easily install solar panels and contribute sustainable energy to the grid.

Delivering reliable air quality information
In addition to mitigating emissions, we’re also focused on helping people adapt to the changing climate. Last year, we launched an air quality layer in Google Maps so people can make informed decisions about where to go and what to do, which has been especially relevant with wildfires affecting so many people globally. With a growing global need for better air quality information, we built our Air Quality API in Google Maps Platform. The API shows reliable air quality data, pollution heatmaps and pollutant details for more than 100 countries around the world.

This API validates and organizes several terabytes of data each hour from multiple data sources — including government monitoring stations, meteorological data, sensors and satellites — to provide a local and universal index. Part of this calculation involves looking at live traffic information to understand congestion data and car volume in an area, and we use machine learning to predict different pollutants in that area at a given time. This process offers companies in healthcare, auto, transportation and more the ability to provide accurate and timely air quality information to their users, wherever they are.
Forecasting the most common allergens
The rise in temperatures and greenhouse gas emissions also causes pollen-producing plants to grow in more places and pollen production to increase, creating additional adverse effects for those with seasonal allergies.
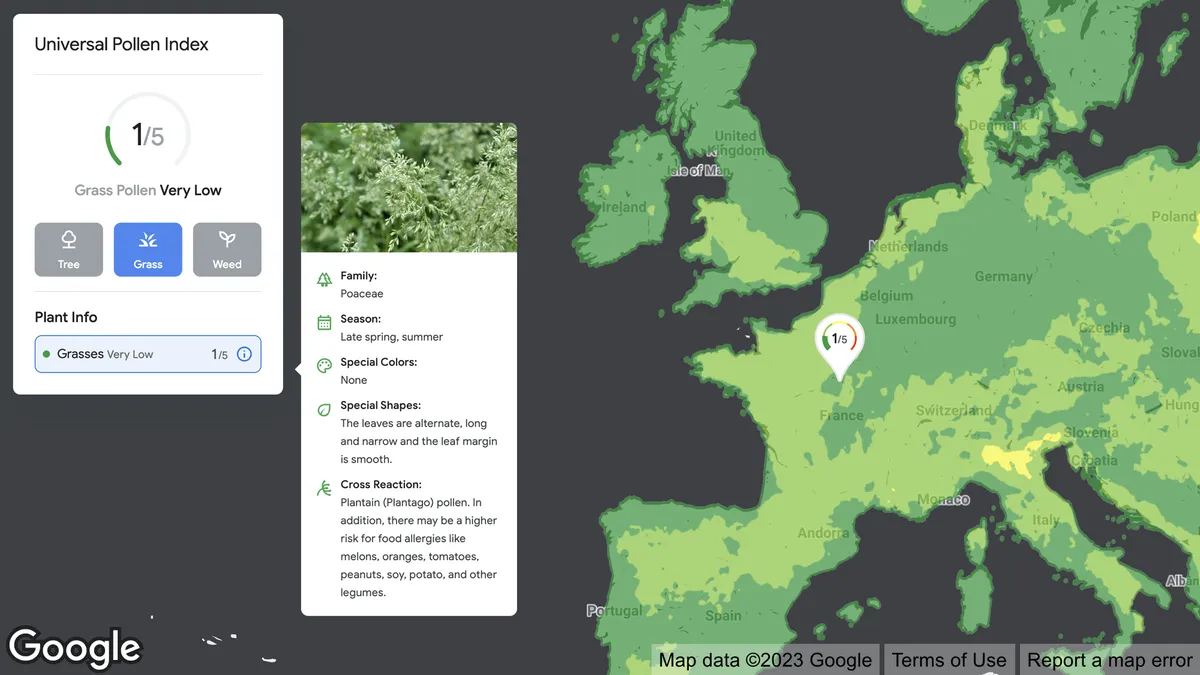
Our new Pollen API shows current pollen information for the most common allergens in over 65 countries. The API provides localized pollen count data, heatmap visualizations, detailed plant allergen information, and actionable tips for allergy-sufferers to limit exposure. To get this information, we use machine learning to determine where specific pollen-producing plants are located. Together with local wind patterns, we can calculate the seasonality and daily amount of pollen grains and predict how the pollen will spread.
With this information, companies that want to help people make healthier decisions have access to data-based insights. For example, a travel planning app can use this pollen information to improve planning for daily commutes or vacations.
With these three new Google Maps Platform APIs, businesses can access comprehensive and up-to-date environmental information to develop sustainability products and help people adapt to the impacts of climate change. We’re dedicated to building tools that organize environmental information and make this data useful for companies, cities and partners so we can all take collective action.


