How we used AI to build our newest Open Buildings dataset
In 2021, the Google Research Africa team launched Open Buildings, an open-source dataset of building footprints across the Global South produced using AI and high-resolution satellite imagery. The team had a simple vision: to fill a major gap in data for population and density in the developing world. Now in its third version, their dataset contains polygons for 1.8 billion buildings over an area of 58 million km² in Africa, South and Southeast Asia, Latin America and the Caribbean.
Governments, the UN and a slew of organizations, researchers and nonprofits have used Open Buildings to understand population size and distribution, enabling more effective planning for vaccination campaigns, disaster response and more. It has even enhanced Google Maps, adding millions of previously unmapped buildings.
The team — centered in Ghana but spread across Tel Aviv, Zurich and beyond — has explored ways to make the project even more useful ever since. “We operate in a constant hackathon mode: trying new ideas, looking at challenges and limitations and thinking, ‘OK, how can we solve this?’” says Google Research program manager Abdoulaye Diack. “One thing we hadn’t been able to capture with the original dataset was how an area evolves over time — the data was static. And it was information partners were seeking.”
Commercial satellite image providers tend to prioritize capturing imagery based on demand and profit, leaving large swaths of the Global South — about 40% of the globe — without any regular and high-resolution coverage, and some remote villages and informal settlements without any coverage at all. More readily available and frequently updated open-source imagery — like that taken by the European Space Agency’s Sentinel-2 satellite, which has a global revisit time of every five days — was long considered too low-resolution to work for the task of building detection.
Hopeful that this low resolution might be less of a hurdle than they thought, the team decided to try it.
First, they put a single low-res frame of an area captured by Sentinel-2 into their model and asked it to produce polygons of the buildings on the ground. “That was a very difficult task, but there was potential,” Abdoulaye says. “So we asked the model to produce just the building masks — or raster data made up of binary pixels linked to specific coordinates — from the image. It did a decent job and we thought: This is doable.”
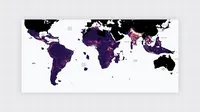
About a year later, and after much painstaking iteration on the model, the team released the Open Buildings 2.5D Temporal Dataset last month. Covering 2016 to 2023, it offers an annual snapshot of building presence and counts across much of the Global South, as well as building heights, showing how development, catastrophe and other factors impact cities. Users simply select a region, toggle between years, and watch the world expand and contract in patterns of colorful shapes.
“About 2.5 billion more people could move to cities by 2050, most of them in the Global South — this could be a real step change for governments and organizations working through that growth,” says Google Research product manager Olivia Graham. “If a city is planning where to put essential services like healthcare and education, or where to develop infrastructure like water and energy supplies, this dataset shows the areas that are actively growing.”
On September 28, 2018, a 7.4 magnitude earthquake off the coast of Indonesia triggered a tsunami, affecting around 1.5 million people on the island of Sulawesi. After this crisis, the built area recedes from the coastline and the effects of the earthquake are visible in the data. You can explore the data in our interactive Earth Engine app.
You can also track the construction of New Cairo, Egypt in the Open Buildings 2.5D Temporal Dataset demo.
How did the team get their model to read Sentinel-2’s blurry satellite images and deliver building detections with confidence? They started by clearing things up.
“We used a teacher-student model setup to simultaneously ‘super-resolve’ the low-res images and extract the building footprints from them,” says Google Research software engineer Krishna Sapkota. “The teacher model is trained to detect buildings on high-resolution images and provides labels for the student model. The student model, which ultimately generates the dataset, learns from the teacher model’s output. It is able to then take low-resolution images from Sentinel-2 and infer what a higher-resolution version would look like.”
The teacher model outputs high-resolution training labels for the student model. It can then infer building presence from low-resolution imagery.
To help get to the level of detail needed to extract building footprints, the model uses up to 32 frames of Sentinel-2 images of a location for any given prediction. Every frame is slightly shifted from the other, given the tiny amount of time that passes between each image’s capture, which is helpful for getting to higher resolution — similar to how Pixel phones can use multiple photos for sharper images.
Unlike the original dataset, which provides precise polygonal outlines of individual buildings, the new temporal dataset represents building footprints as raster data. The model is also able to predict building heights — critical for making estimations of population density — with a mean absolute error of just 1.5 meters, or far less than one building story.
In the lead up to its official release, the temporal dataset was opened to trusted partners, including Ugandan nonprofit Sunbird AI. “About 73% of people in Uganda don’t have access to electricity, and Sunbird AI has used our original database to work with the government there to understand which areas might be best suited for things like microgrids or solar panels for individual homes,” Olivia says. “With the new dataset, they’re looking at two towns, Jinja and Fort Portal, and producing graphics that allow the city councils to understand the most rapid areas of growth and adjust their resource plans accordingly. It shows how both datasets can be used as part of a larger toolkit to help understand a population and, vitally, how it’s changing.”
The same spirit of curiosity that led to the temporal dataset is driving the team to work on enhancing it for the future.
“I live in Ghana and I can see first-hand the difference our work is making and can make,” Abdoulaye says. “Many places on the continent face a lack of resources, which can lead to a lack of data and have strong follow-on consequences. To be part of a team working to change that, and making an impact, is a privilege.”