A brief history of our search interest in cozy season


Oversized sweater: check. Mug of tea: check. A chill in the air: check. That’s right: It’s winter (in the northern hemisphere at least), and it’s time to snuggle in, hunker down or bundle up — whatever your cozy preference may be. On that very seasonal note, we took a look at different coziness-related U.S. searches and how they’ve performed over time.
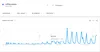
- Let’s start with the basics: U.S. search interest in coziness appears to have steadily increased over time. Since 2004, searches for “cozy” have dependably ticked upward each winter.
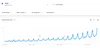
2. They’ve also consistently peaked in December, perhaps making it the official coziest month.
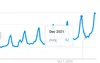
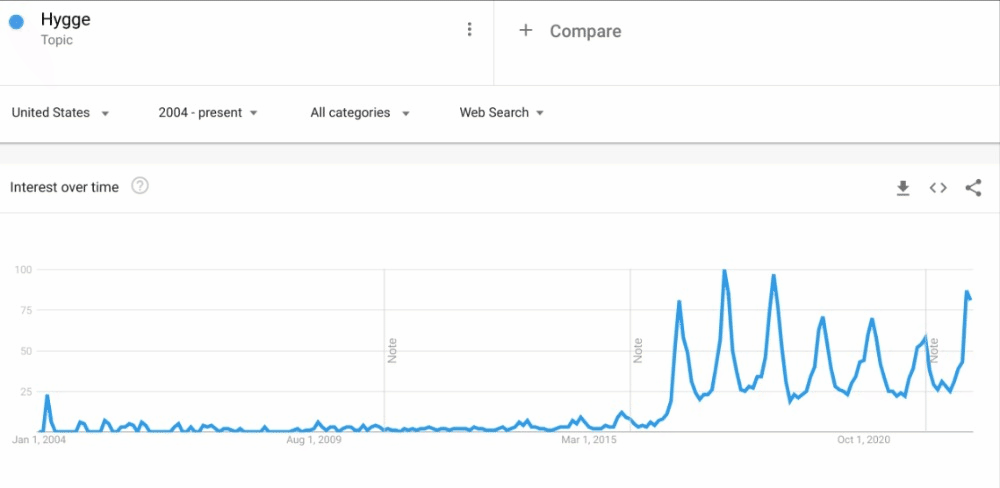
3. As our interest in coziness has grown, so, too, has the nuance (and specificity!) behind some of our coziness-related searches. Enter Hygge — a Danish and Norwegian word for the feeling of being cozy and content. Searches for Hygge exploded in January 2017 — even though the term itself has been around for far longer. In fact, if you take a look at ngrams (which shows how words and phrases appear in our database of books), you’ll see it started showing up in published materials in the 1960s.
4. In years past, Hygge searches peaked in December and January. We hit this year’s Hygge heights during the second week of November.
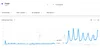
5. Since 2016, Hygge has also seen a rise in image search interest, suggesting we both want to know about hygge and what it looks like.
6. And speaking of the aesthetics of hygge and coziness, there are few things comfier than a soft, chunky sweater. Coincidentally, searches for “sweater weather” peaked in December 2013, which just so happens to be the year that the song “Sweater Weather” was released.
7. Outside of this musical peak, though, over the past five years, searches for “sweater weather” increase in the fall and winter and decrease in the spring and summer, alongside the other items on this list.
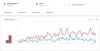
8. While we’re on the subject of soft, snuggly things: The perfect time for snuggling is “cuffing season.” While it’s been on Google Trends’ radar since 2004, “cuffing season” exploded in November 2016. Since then, it’s peaked in October or November each year, arguably making this more of an autumnal phenomenon.
9. Interestingly, searches for “cuff it” also follow a similar trajectory as “cuffing season,” though “cuff it” is a more popular search term.
10. However, take a look at the related queries for “cuff it.”

It’s pretty obvious why the search term took off.
11. And finally, while we’re on the topic of musical artists who overlap with cozy season, I had to check out another singer’s Google Trends stats:
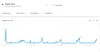
Search interest in Mariah Carey rises every winter — and I don’t think there’s any mystery as to why.