I/O 2026: Welcome to the agentic Gemini era

Editor’s note: Below is an edited transcript of Google CEO Sundar Pichai’s remarks at Google I/O 2026, adapted to include more of what was announced on stage. See all the announcements in our collection.
It’s been an extraordinary year since our last I/O, a period of relentless shipping, technology advances and hyper progress. We’re now in the part of the AI cycle where people want to see the value in the products they use every day. We’ve been really focused on that, and you’ll see that in the products and features we’re announcing today at I/O.
Ten years since we pivoted the company to be AI-first, we still see AI as the most profound way to advance our mission and improve people’s lives at scale.That’s why we’ve been taking a differentiated, full-stack approach to AI innovation, from our custom silicon and secure foundation, to our world-class research and models, to our products and platforms that touch billions of people. This approach enables us to iterate and innovate faster in ways that are lighting up every part of the company.
What’s incredible is how people are using AI, whether it’s students prepping for final exams with the Gemini app, musicians and artists using generative AI models like Lyria and Veo as part of their creative flow, or developers coding and bringing their ideas to life.
AI momentum across the full stack
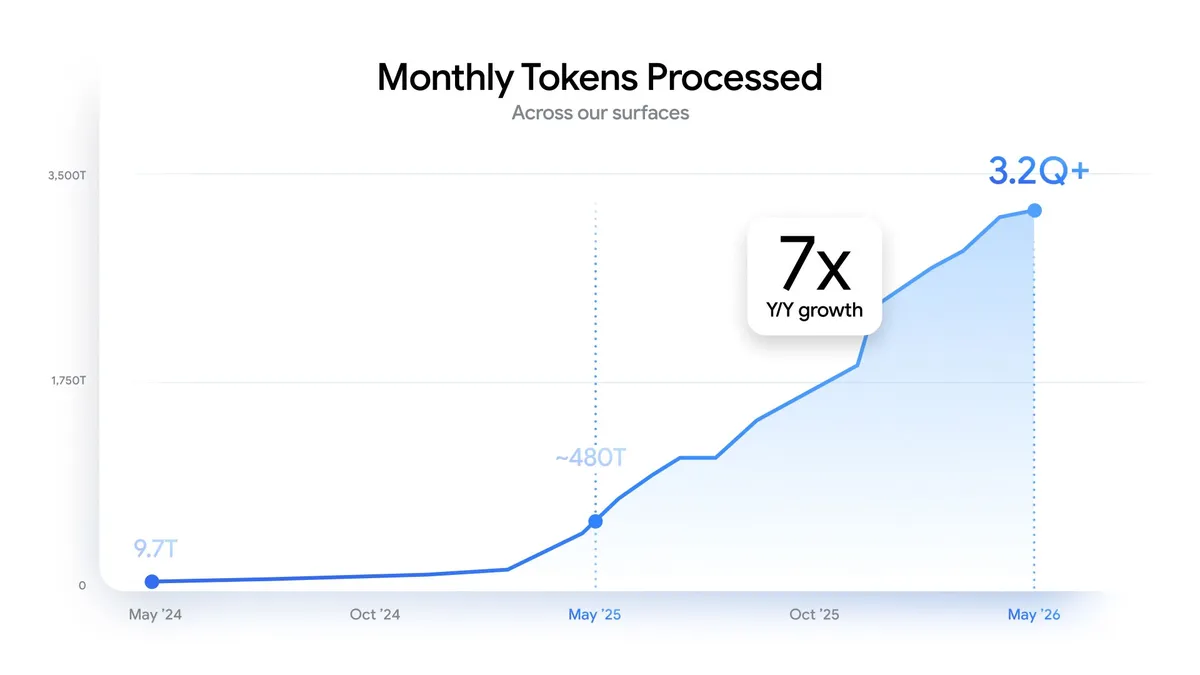
These stories of how people are using AI are the best measure of progress. To understand the scale at which people are adopting AI, there is another great proxy — tokens, the fundamental units of data our models process, many representing a problem being solved.
Two years ago, we were processing 9.7 trillion tokens a month across our surfaces — a huge number. Last year at I/O, that grew to roughly 480 trillion tokens. Fast forward to today, that number jumped 7x to over 3.2 quadrillion per month.
It tells an important story about our products and how others are building as well — especially developers and enterprises:
- Over 8.5 million developers are now building new apps and experiences with our models monthly.
- Our model APIs are now processing roughly 19 billion tokens per minute.
- Over the past 12 months, over 375 Google Cloud customers each processed more than one trillion tokens, representing incredible demand for AI from across industries.
Momentum with our products
Today we have 13 products with over a billion users each. Five of those have more than 3 billion users.
Our Gemini models are a big reason more people are using our products, and why they're using our products more.
It all starts with Search, which is bringing the benefits of generative AI to more people than any other product in the world. AI Overviews now has over 2.5 billion monthly active users. And AI Mode has been a revelation, our biggest upgrade to Search ever. People love it, and in just a year, it’s already surpassed 1 billion monthly active users.
When people use our AI-powered features in Search, they use Search more. Search has become less about individual queries and feels more like an ongoing conversation, giving you deeper insights and connecting you with the vastness of the web.
Another place where we’ve been rapidly innovating is in the Gemini app. Last year at I/O, the Gemini app had 400 million monthly active users. Today, we’ve surpassed 900 million, more than doubling in a year. In that same time, daily requests have grown over seven times.
We’ve been adding a lot of unique features like Personal Intelligence, which make responses more customized and helpful. And to date more than 50 billion images have been generated with our Nano Banana image generation models. It was a breakout star this past year, showing how much latent creativity there is in the world.
Natural, conversational AI in products
There’s also a lot of latent productivity to be unlocked. Over the last year, we’ve been bringing the ability to have more natural conversations with Gemini directly inside our products. Recently, Maps got its biggest upgrade in a decade, including a new feature called Ask Maps. People are using Ask Maps for more complex, and much longer questions.
Now we’re bringing more natural conversational AI to more products.
Ask YouTube
People come to YouTube everyday to ask a lot of questions. There’s a lot of great videos, but sometimes it’s hard to know where to start.
Ask YouTube entirely reimagines the experience, making information much more digestible and easy to navigate. You’ll see videos that best match your interest, and most importantly, it jumps right to the part of the video most relevant to you.

We’re starting to test Ask YouTube now, and it will roll out broadly in the U.S. this summer.
Voice-powered Docs Live
There are a lot of times I want to get things done at the speed of my voice. That is much more possible today thanks to technical leaps in our audio models.
A new feature called Docs Live takes this to another level. To create a doc with Gemini before, you had to type out a precise prompt. With Docs Live, you can just verbally “brain dump” whatever is on your mind, and let Gemini do the rest.
In the future, you’ll be able to create new docs and edit them directly, all with your voice. Docs Live is rolling out for subscribers this summer, and powerful voice capabilities will come to Gmail and Keep then too.
Infrastructure supporting innovation at scale
It’s incredible to see the pace of innovation rolling out across our products. Supporting all of this scale for our users, while also serving enterprises and developers around the world, requires massive investments in infrastructure. We’ve been investing for now and for the future. In 2022, we were spending $31 billion annually in capex. This year, we expect that number to be about six times that, approximately $190 billion. A key part of this investment is our custom silicon.
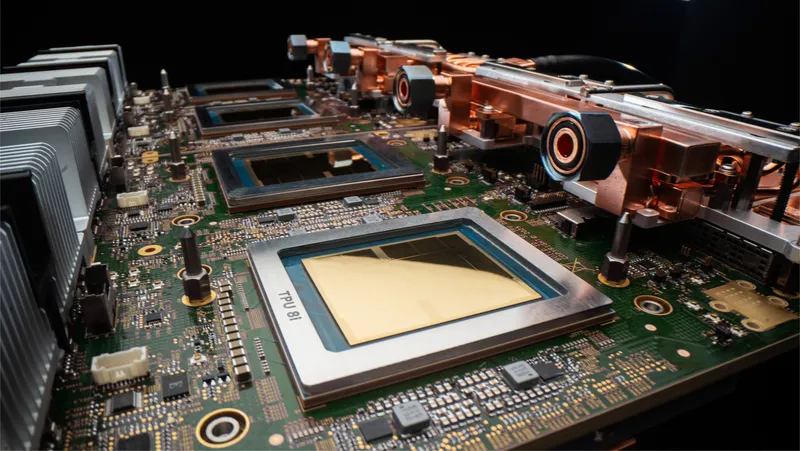
A decade ago, we announced our very first commercial tensor processing unit, or TPU, on the I/O stage. Since then, we have transformed how the industry builds for AI. We recently announced our 8th generation of TPUs at Cloud Next. For the first time, we’ve taken a dual chip approach with specialized architectures for training and inference: TPU 8t and 8i.
- TPU 8t is optimized for large-scale pretraining, and it’s nearly three times the raw computing power of our previous generation. We’ve taken a fundamentally different approach with our training infrastructure. With JAX and Pathways, our training is no longer constrained by the limits of a single, massive data center. Instead, we can now seamlessly distribute training across multiple sites, scaling training across more than 1 million TPUs globally. This gives us the ability to create the largest training cluster in the world. For model builders, this means training larger, more capable models in weeks rather than months.
- TPU 8i is designed for inference. We have dramatically improved speed at every step. Because if we learned anything in 27 years of working on Search, it's that latency matters.
In addition to speed, we’re also thinking about scaling sustainably. Both chips are more energy efficient, delivering up to two times better performance-per-watt.
Gemini Omni
This progress with TPUs is how we can make compute advances across models, coding and agents. With world models, AI is moving from predicting text to simulating reality. We have been working to push the boundaries of what these models can do.
Gemini Omni is our new model that is capable of generating samples in any output modality from any input. We’re starting with video outputs, and over time we’ll enable image and text. This new model combines Gemini’s intelligence with our generative media models — a huge leap forward in world understanding. We’re launching the first model in the Omni family: Gemini Omni Flash.
Gemini Omni Flash is available starting today. You will be able to try it on the Gemini app, Google Flow and on YouTube Shorts. We'll also be rolling it out to developers and enterprise customers via APIs in the coming weeks.

New SynthID updates and partners
As generative AI gets better, so does the need for greater transparency. Research shows people can correctly identify high-quality deepfake videos only about a quarter of the time. Three years ago, we launched SynthID, our watermark that is invisible to the naked eye. Since launch, SynthID has now watermarked over one hundred billion images and videos, along with sixty thousand years of audio assets.
Millions of people are using our SynthID detector in the Gemini app to verify AI-generated content. And now we’re going a step further and adding Content Credentials verification across products. This will show you if the origin of the content was AI or a camera, and if it’s been edited with generative AI tools. We want more people to have easy access to these tools, so we’re expanding both Content Credentials and SynthID verification to Search and Chrome.
Of course, this only works at scale if more partners decide to watermark their own AI-generated content. Nvidia signed on to SynthID last year. And today, we are thrilled to announce that OpenAI, Ka-Kow and Eleven Labs are adopting SynthID, too. It’s great to see the cross-industry collaboration. We’re looking forward to expanding to more partners and setting the standard of transparency for the AI era.
Gemini 3.5 Flash
Gemini 3 launched a few months ago, with a full family of models. It’s our most adopted series yet. We've loved seeing developers use Flash as their daily driver, and build incredible experiences with Pro's deep reasoning and multimodal capabilities. We’ve been hard at work on improving these models, especially focused on agentic coding, long-horizon tasks and real-world workflows.
Today, we’re introducing Gemini 3.5 Flash, our first in a series of models combining frontier intelligence with action. Two things I’d highlight:
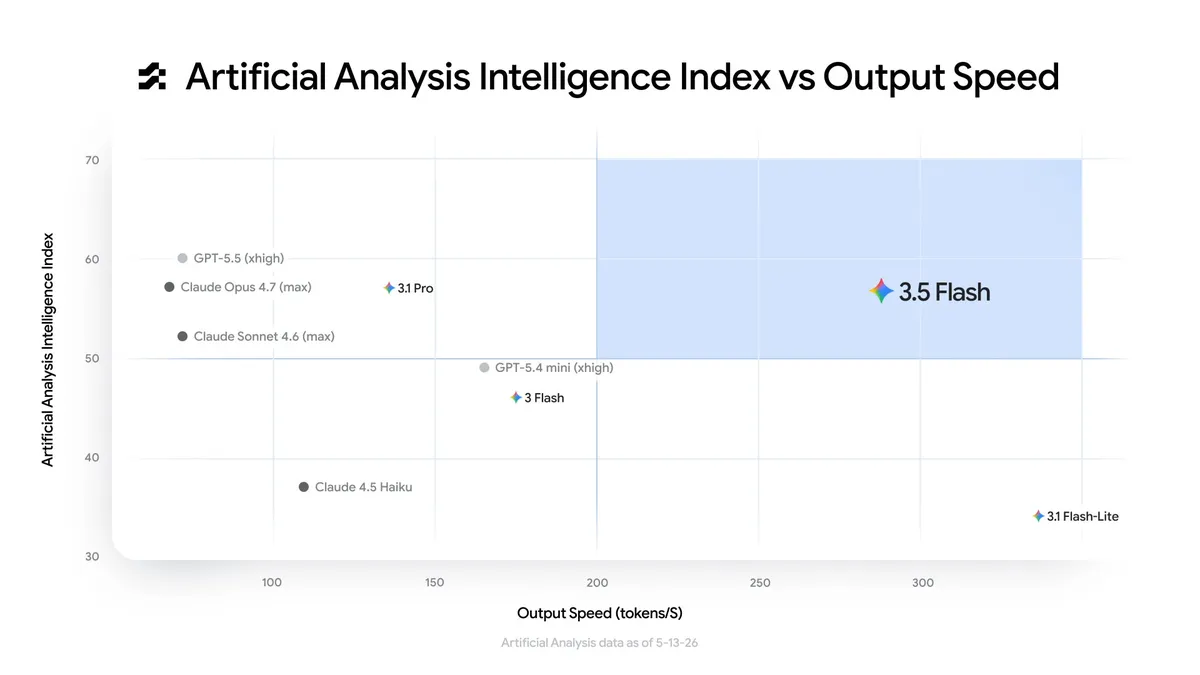
- When compared to 3.1 Pro, 3.5 Flash is better across almost all benchmarks. It’s made huge progress in coding — and look at the extraordinary jump in GDPVal. This captures many real-world economically valuable tasks.
- Gemini 3.5 Flash is a very capable model, at the frontier and comparable to the best models, but it’s still very fast. Which is why when you look at the intelligence versus output speed, it’s in a league of its own in the top right quadrant. When looking at output tokens per second, it is four times faster than other frontier models.
The new model has been a game changer for us internally at Google. We’ve been using 3.5 Flash with a reimagined version of our agent-first development platform Antigravity, and it’s dramatically accelerated how we build. In March we were processing half a trillion tokens a day internally across our AI developer tools, and we’ve been doubling every few weeks. Now, we’re processing more than three trillion tokens a day. This scale created a powerful feedback loop helping us improve 3.5.
What’s amazing about Flash is how it delivers frontier-level capabilities at less than half the price of comparable frontier models. We’ve heard that many companies are already blowing through their annual token budgets, and it’s only May. If companies used a mix of Flash and other frontier models they could save a lot of money. To put this in perspective, top companies are processing about 1 trillion tokens a day. If they shifted 80% of their workloads from other frontier models to 3.5 Flash, they’d save over $1 billion dollars annually. That is real savings they can pour back into their company.
Gemini 3.5 Flash is available for everyone today across our products and APIs. We’re also excited for Gemini 3.5 Pro. We are using it internally, it’s showing great improvements, and it will be coming next month.
Antigravity 2.0
We’re also bringing 3.5 Flash to developers in Antigravity.
Antigravity is expanding beyond the coding environment, turning it into a platform to develop and manage cohorts of autonomous AI agents. This includes Antigravity 2.0, a new standalone desktop application that acts as a central home for agent interaction, where anyone can orchestrate agents for all sorts of tasks. And we developed an even more optimized version of Flash: not just 4x but 12x faster than other frontier models.
Users in Antigravity can get a taste of this experience starting today. Read more about Antigravity 2.0 here.
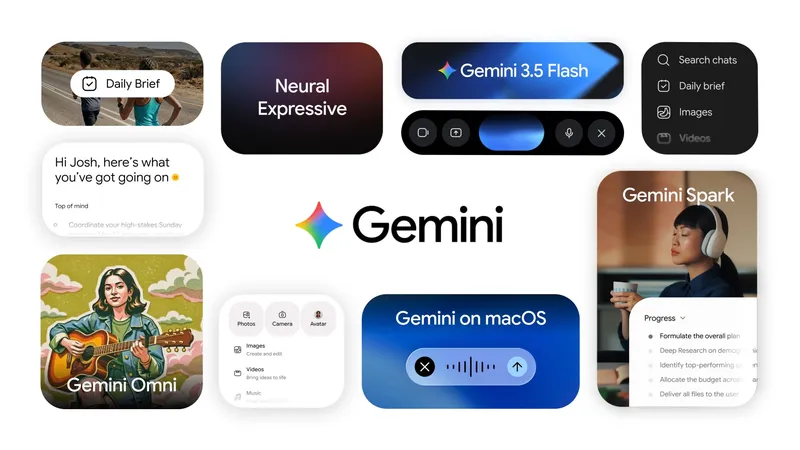
Gemini Spark is your 24/7 agent
Gemini 3.5 and Antigravity are unlocking a new world of agents and agentic capabilities. We’ve been bringing agents to developers and enterprises for a while. Now we are super focused on bringing the power of agents, safely and securely, to consumers so that it works for everyone. You’ll see agentic experiences across many of our products today.
I’m particularly excited for Gemini Spark, your personal AI agent in Gemini app that helps you navigate your digital life, taking action on your behalf and under your direction.
- It runs on dedicated virtual machines on Google Cloud. And it’s 24/7 so you don’t need to keep your laptop open.
- It’s powered by Gemini 3.5 and the Google Antigravity harness, which allows it to perform long-horizon tasks easily in the background.
- Spark will integrate seamlessly with tools, starting with our own, and in the coming weeks with third-party tools through MCP.
- And you can work with Spark however is most convenient: in the Gemini app or soon, through email and chat.
- On Android, you will be able to view live updates and task progress of agents like Spark through a new UI space called Android Halo, coming later this year. Later this summer, Spark will operate directly within Chrome, acting as your agentic browser across the web.
We’re starting to roll out Gemini Spark to trusted testers this week and the Beta is coming to Google AI Ultra subscribers in the U.S. next week.
Search in the agentic era
Gemini Spark is the first experience made possible by 3.5 models and Antigravity. This combination gives us new ways to accelerate our mission and transform our products to be radically more helpful.
As we enter this agentic era, Search will be more helpful and powerful than ever. Today, we’re introducing information agents in Search. These are personalized AI agents you can set up to work in the background, 24/7, to find what you need at exactly the right moment, and help you take action. Information agents are rolling out this summer starting with Google AI Pro and Ultra subscribers.
Another way we’re building a truly agentic Search is by infusing it with agentic coding capabilities. With the power of Gemini 3.5 Flash and Google Antigravity, Search will build custom experiences just for your individual questions, like dynamic layouts and interactive visuals. These generative UI capabilities will be available for everyone in Search this summer, free of charge.
And for longer running tasks that you need to keep coming back to, Search can go a step further — building persistent, custom dashboards or trackers that you can return to and make progress on. You can think of these like mini apps for your own specific tasks. You’ll be able to build custom experiences with Antigravity, right in Search in the coming months, starting first for Google AI Pro and Ultra subscribers in the U.S.
More from our agentic Gemini era
Here’s a look what else we shared at I/O:
- Daily Brief is another out-of-the-box agent coming to the Gemini app. It gives you a personalized digest and synthesizes information from your inbox, calendar and tasks to find the most important things to be aware of. And it’s not just summarizing data: it’s prioritizing, organizing and suggesting the next steps, so it’s easy for you to take action. All in this super concise morning digest that’s built for skimming.
- Google Flow is rolling out a new agent today to everyone that can plan and reason through complex tasks with your inputs, under your control. Built with Gemini models, it brings expertise and a deep understanding of your project to help with early brainstorming, creating and editing. You can also vibe code any creative tool, right in Flow — like tools for designing video effects, hand-drawn animations or layering text.

- Google Pics is our new AI image creation and editing tool, built on our latest Nano Banana model, that helps you create just about anything with the creative controls you want. Whether you’re building a design from a blank canvas or editing an existing photo, Pics treats every element as an individual object rather than a flat, static image. This allows you to create, swap or perfect specific details, so you can bring your exact vision to life. Google Pics is available now to trusted testers and will be rolling out later this summer to Google AI Pro and Ultra subscribers in Workspace.
- We also shared more about our intelligent eyewear, which we first gave a glimpse of last year, including audio glasses that offer spoken help in your ear and display glasses that show you the information you need, right when you need it. Both let you stay hands-free and heads up, with help from Gemini just by asking. Audio glasses are launching first, coming later this fall.

- Gemini for Science brings together a number of AI tools to help accelerate scientific research. Building on the deep reasoning and research capabilities of Gemini as well as Deep Think and Deep Research, it includes new experiments on Labs as well as Science Skills to connect agentic platforms like Google Antigravity to over 30 major life science databases and tools. Users can express interest to try Gemini for Science experiments on Google Labs, and Science Skills is available today on Github and directly in Antigravity.
As we look across the full stack of innovation, from the infrastructure behind TPU 8i to the frontier capabilities of Gemini 3.5 and Antigravity, it’s clear we’re firmly in our agentic Gemini era. I’m excited to see how it will unlock new ways to accelerate our mission and transform our products to be radically more helpful, for everyone everywhere.
See everything we announced here.